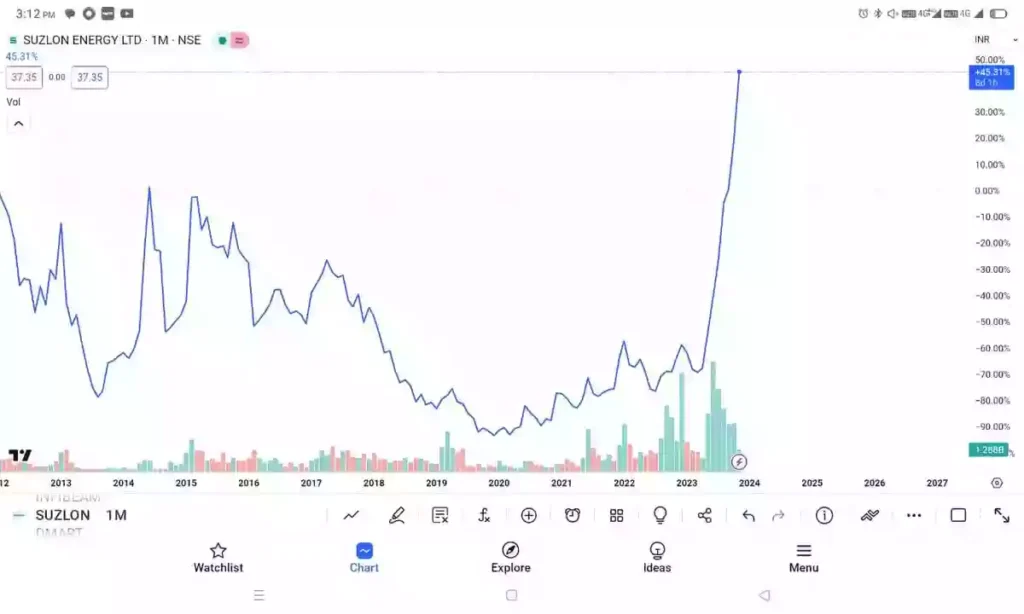
In the unpredictable world of the stock market, we can’t predict the value of any stock just by looking at their Current charts but with the help of some fundamentals analysis we can actually estimate its value for the upcoming period. Fundamental analysis is a deep study of a company’ s inner operation.
If you are looking for stocks with good returns in the energy segment, Suzlon Energy Ltd. can be a profitable investment option.
Suzlon is India’s leading renewable energy solutions provider offering a 360-degree total solutions package to its customers that covers the entire spectrum of wind energy projects.
Suzlon Energy Ltd quote is equal to 41.34 INR at 2023-11-21. Based on our forecasts, a long-term increase is expected, the “SUZLON” stock price forecast for 2028-11-13 is 62.442 INR. With a 5-year investment, the revenue is expected to be around +51.0%

Suzlon Energy Limited Fundamentals
| Market Cap | ₹ 53,497.86 |
| Enterprise Value | ₹ 55,539.23 Cr. |
| No. of share | 1,361.27 Cr |
| P/E | 0 |
| P/B | 15.33 |
| Face value | ₹ 2 |
| Dividend Yield (Last Year) | 0% |
| Book Value | 19.31 |
| Debt | ₹0 |
| EPS | ₹ -0.11 |
| ROE | 0% |
| ROCE | 126.41% |
| Profit growth (1 year) | 28% |
| Sales growth | -11.13% |
| Cash | ₹ 290.63 Cr. |
| Debt to Equity | 0 |
| Promoter’s Holding | 13.29 % |
| Operating Profit Margin | 23.00% |
SUZLON ENERGY PROS AND CONS
| Suzlon shown a great revenue growth of 112.16% over the past 3 years | Suzlon has a poor ROE of 0% over the past 3 years. |
| Suzlon energy decreased its debt by 1,929.23 Cr. | Suzlon has negative cash flow from operations of -31.15. |
| Suzlon has been sustain good ROCE of 50.54% over the last 3 years | Suzlon has a low EBITDA margin of -51.09% over the past 5 years. |
| Suzlon cash conversion cycle is -31.96 days which is good for renewable energy industry | Currently Suzlon shares are treding at a high EV/EBITDA of 198.49. |
- Pros – Returns on stock is excellent
- Cons- debt equity ratio is high
- Pros- there is hope for high returns for this stock
- Cons-sales growth is not up to mark since 4 quarters
Why buy Suzlon energy ?
Company is a renewable energy solutions provider and is in the business of manufacturing, project execution and operation and maintenance of wind turbine generators and sale of related components.
It has installed 20+ GW of wind energy in 17 countries and 111+ wind farms with a capacity of 13,880 MW. Company client portfolio includes power utilities and electricity producers in both the private and public sectors.
As in india and across the world every enterprise is focusing on renewable
Source of energy and suzlon energy will be the dark of this sector
On May 24th 2022, company allotted 57,14,28,572 equity shares and converted entire outstanding value of 4.10 Lac Optionally Convertible Debentures of Rs.1 Lac each issued on preferential basis to the existing lenders in terms of the Refinancing Proposal, aggregating Rs.4,099.18 Crore.
It also converted 4,45,301 Compulsorily Convertible Preference Shares issued by Suzlon Global Services Limited into 4,454 equity shares, to be allotted to the Existing Lenders
WHY TO ADD SUZLON IN OUR PORTFOLIO ?
Recently this company has increased its share capital Rs.9,200 Crore to Rs.11,000 Crore
While buying any stock we should keep in mind a few thing about any company, fundamental analysis is called as backbone of investing
Fundamental analysis reflect company inner operation pace and it’s consistency through out back years and for upcoming years
While doing fundamental analysis we should focus on company’s growth
And this can be found out by looking company’s balance sheet , it’s total net profit and sell, it’s quarterly and annual reports, promoters investment including foreign and domestic , cash flow , some important ratios like P/B ratio. P/E ratio, company debts, it’s inner operation and most importantly it’s yearly sales growth
In this article we have provided all the important table which will be very useful for making a precise decision about investing in this stock and determining our share price Target for the next five years .

Suzlon Energy Share Price Target 2023,2024,2025,2026,2027,2028,2029,2030
| Year | January Target | December Target |
| Suzlon share price target 2023 | ₹37 | ₹44.6 |
| Suzlon share price target 2024 | ₹42.09 | ₹44.6 |
| suzlon share price target 2025 | ₹44.8 | ₹49.9 |
| suzlon share price target 2026 | ₹49.3 | ₹53.6 |
| suzlon share price target 2027 | ₹53.9 | ₹57.8 |
| Suzlon share price target 2028 | ₹58.3 | ₹62.6 |
| Suzlon share price target 2029 | ₹67.8 | ₹76.8 |
| Suzlon share price target 2030 | ₹77.8 | ₹87.7 |
Looking at the above charts and its predictions it shows that Suzlon energy is expected to give nearly 60% growth in its price which makes our portfolio more strong and attractive.
Theory behind expected share price of suzlon energy limited
Price in the stock market depends on demand and supply in the market. Looking at suzlon energy it seems that its demand will be high in future because our government is supporting these green energy resources to control co2 emissions.
Below we are attaching this stock’s performance in previous years
you can find here it’s sales growth, it’s balance sheets, and some important charts which will help you to make your investment decision precise and accurate.
Suzlon energy share price target 2024
| Month | Minimum | Maximum |
|---|---|---|
| January 2024 | 39.792 | 41.84 |
| February 2024 | 41.22 | 41.85 |
| March 2024 | 41.74 | 41.69 |
| April 2024 | 42.79 | 42.74 |
| May 2024 | 42.75 | 43.91 |
| June 2024 | 44.17 | 44.94 |
| July 2024 | 44.60 | 44.66 |
| August 2024 | 44.62 | 43.92 |
| September 2024 | 43.56 | 43.97 |
| October 2024 | 43.40 | 45.86 |
| November 2024 | 45.76 | 43.35 |
| December 2024 | 43.14 | 44.27 |
Suzlon energy share price target 2025
| Month | Minimum | Maximum |
|---|---|---|
| January 2025 | 44.43 | 45.81 |
| February 2025 | 45.923 | 46.77 |
| March 2025 | 46.52 | 46.59 |
| April 2025 | 46.55 | 47.45 |
| May 2025 | 47.40 | 48.75 |
| June 2025 | 48.73 | 49.13 |
| July 2025 | 49.03 | 49.51 |
| August 2025 | 49.22 | 49.42 |
| September 2025 | 48.12 | 48.91 |
| October 2025 | 48.51 | 50.32 |
| November 2025 | 50.42 | 41.37 |
| December 2025 | 47.03 | 48.91 |
PROFIT AND LOSS statement of Suzloan
This table shows the annual sales growth of suzlon energy of last 5 years
Which is growing annually and it shows good strength of company and we can relay on
| Particulars | March 2019 | March 2020 | March 2021 | March 2022 | March 2023 |
|---|---|---|---|---|---|
| Net Sales | 2,543.50 | 375.95 | 1,247.31 | 4,040.04 | 3,590.44 |
| Total Expenditure | 2,791.02 | 1,280.27 | 1,349.21 | 3,971.75 | 3,544.22 |
| Operating Profit | -247.52 | -904.32 | -101.90 | 68.29 | 46.22 |
| Other Income | 499.48 | 243.11 | 71.48 | 64.13 | 206.06 |
| Interest | 943.65 | 1,140.57 | 983.07 | 777.08 | 441.56 |
| Depreciation | 438.91 | 682.15 | 186.50 | 185.13 | 190.04 |
| Exceptional Items | -6,281.38 | -792.05 | 801.59 | -82.87 | 2,542.08 |
| Profit Before Tax | -7,411.98 | -3,275.98 | -398.40 | -912.66 | 2,162.76 |
| Tax | 1.35 | 0.65 | 0 | 0 | 0 |
| Net Profit | -7,413.33 | -3,276.63 | -398.40 | -912.66 | 2,162.76 |
| Adjusted EPS (Rs.) | -12.79 | -5.65 | -0.43 | -0.91 | 1.76 |
CASH FLOW statement
a valuable measure of strength, profitability, and the long-term future outlook of a company.
| Particulars | Mar 2012 | Mar 2013 | Mar 2014 | Mar 2015 | Mar 2016 | Mar 2017 | Mar 2018 | Mar 2019 | Mar 2020 | Mar 2021 | Mar 2022 |
|---|---|---|---|---|---|---|---|---|---|---|---|
| Cash from Operating Activity + | 839 | 556 | 568 | 1,119 | -739 | 1,602 | -109 | 1,267 | -929 | 530 | 1,302 |
| Cash from Investing Activity + | -643 | -328 | -439 | -825 | 4,482 | -643 | -138 | 125 | -32 | -24 | -19 |
| Cash from Financing Activity + | -249 | -901 | 360 | -199 | -5,656 | -1,249 | 492 | -1,898 | 969 | -327 | -1,045 |
| Net Cash Flow | -53 | -673 | 489 | 95 | -1,914 | -290 | 245 | -506 | 8 | 180 | 238 |
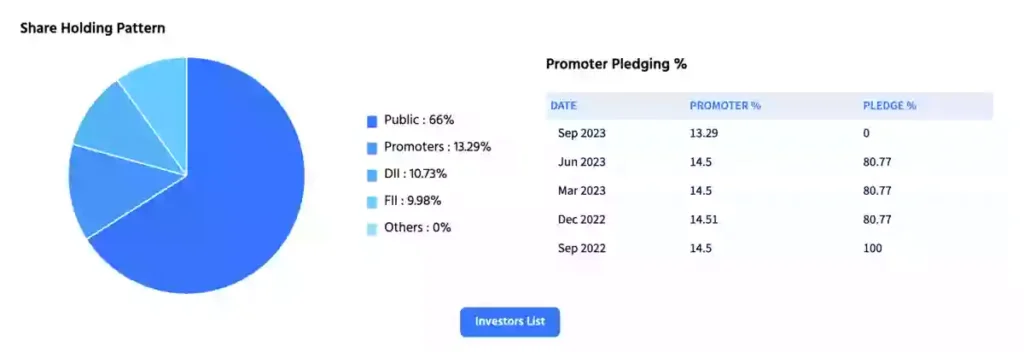
SHARE HOLDING PATTERN
It’s shows company share theory means how much part of company’s is diluted in share market.
| Particulars | Dec 2020 | Mar 2021 | Jun 2021 | Sep 2021 | Dec 2021 | Mar 2022 | Jun 2022 | Sep 2022 | Dec 2022 | Mar 2023 | Jun 2023 | Sep 2023 |
| Promoters + | 17.46% | 17.17% | 16.52% | 16.41% | 16.04% | 15.85% | 14.92% | 14.50% | 14.50% | 14.50% | 14.50% | 13.28% |
| FIIs + | 3.10% | 4.22% | 4.08% | 4.10% | 4.85% | 5.52% | 6.29% | 7.84% | 7.65% | 7.64% | 7.79% | 10.88% |
| DIIs + | 17.23% | 16.54% | 17.72% | 17.06% | 14.62% | 13.57% | 15.50% | 8.24% | 5.82% | 5.55% | 5.90% | 9.81% |
| Government + | 0.00% | 0.00% | 0.00% | 0.00% | 0.00% | 0.00% | 0.00% | 0.00% | 0.00% | 0.00% | 0.02% | 0.02% |
| Public + | 62.21% | 62.07% | 61.69% | 62.43% | 64.49% | 65.06% | 63.29% | 69.40% | 72.02% | 72.30% | 71.78% | 65.99% |
| No. of Shareholders | 10,46,929 | 11,17,927 | 12,20,464 | 13,15,912 | 15,46,564 | 20,70,709 | 21,15,057 | 22,35,310 | 24,31,136 | 24,42,672 | 24,90,961 | 28,68,152 |

If we looking at their Share holding pattern, its bit scary because promoters and big investment house has been pledging their holding.
CONCLUSION
Through this article I have tried my best to give all detailed data of this stock
By simply going through this you can make your decision whether you are going to buy this stock or not, this stock is currently in positive trend which shows that it will continue in bullish trend for next some years, we are not sebi advisor kindly consider this for only educational purposes.and make your financial decision independently.
Hi, I’m Ashish, the author here. With a solid background in data analytics and statistics, I bring you straightforward insights into the stock market. I research stocks inside out, blending fundamental and technical analyses. My goal is to provide you with clear, actionable content that simplifies the complexities of investing. Join me on this journey for straightforward advice and a data-driven approach to making informed decisions in the stock market.


